Data Analyst Resume Examples With Templates
Data analyst resume examples from entry-level to data scientist, across BI and analytics engineering, plus a copyable template and the SQL and tools to list.
A data analyst's resume has to prove one thing above all: that your analysis changed a decision. Anyone can list SQL, Python, and Tableau — the resumes that get interviews show a question someone asked, the analysis you ran, and what the business did differently because of it. Hiring managers scan first for the technical stack and then for evidence that you turned data into an outcome. Below are data analyst resume examples for every level and specialty, from an entry-level analyst to a senior data scientist, each linked to a live sample you can open, plus the skills, sections, and numbers that get a resume past an applicant tracking system and in front of a hiring team.
The examples come first, then a text template you can copy, then the writing advice behind all of them — a tight technical summary, impact-driven analysis bullets, the right skills section, and the keywords a company's hiring software scans for. The general rules that apply to any resume are collected in our resume writing guide; this page is the data-specific version.
How these examples were made. Each résumé below is a real Prezumi template rendered from a complete analytics profile — the same builder you'd use for your own — not a static mock-up. The names, companies, and numbers are illustrative. The stack and hiring conventions reflect how data teams commonly screen resumes; they vary by company and country, so read the posting before you copy anything wholesale.
Data analyst resume examples by level and specialty
"Data" covers a spread of roles that look similar on a job board and feel very different day to day. An entry-level analyst building dashboards and a data scientist shipping a forecasting model share tools and almost nothing else about the problems they solve, and their resumes should look as different as their work does. Each example below is a real resume rendered in a clean, ATS-friendly Prezumi template — so you can see the exact format for your level and specialty and then build your own from the same structure. Click any example to enlarge it, or use it as your starter profile with one tap.
Entry-level data analyst (entry level)
An entry-level data analyst resume has to show you can already do the core work even without years on the job. This one leads with the stack — SQL first, then Excel, a BI tool like Tableau or Power BI, and some Python or R — then makes real analysis carry the weight: a capstone, an internship, a Kaggle or portfolio project, or a dashboard you built for a student org. The strongest entry-level bullets name the question, the data, and the decision or insight that came out, with a live link to a dashboard or notebook a reviewer can open.
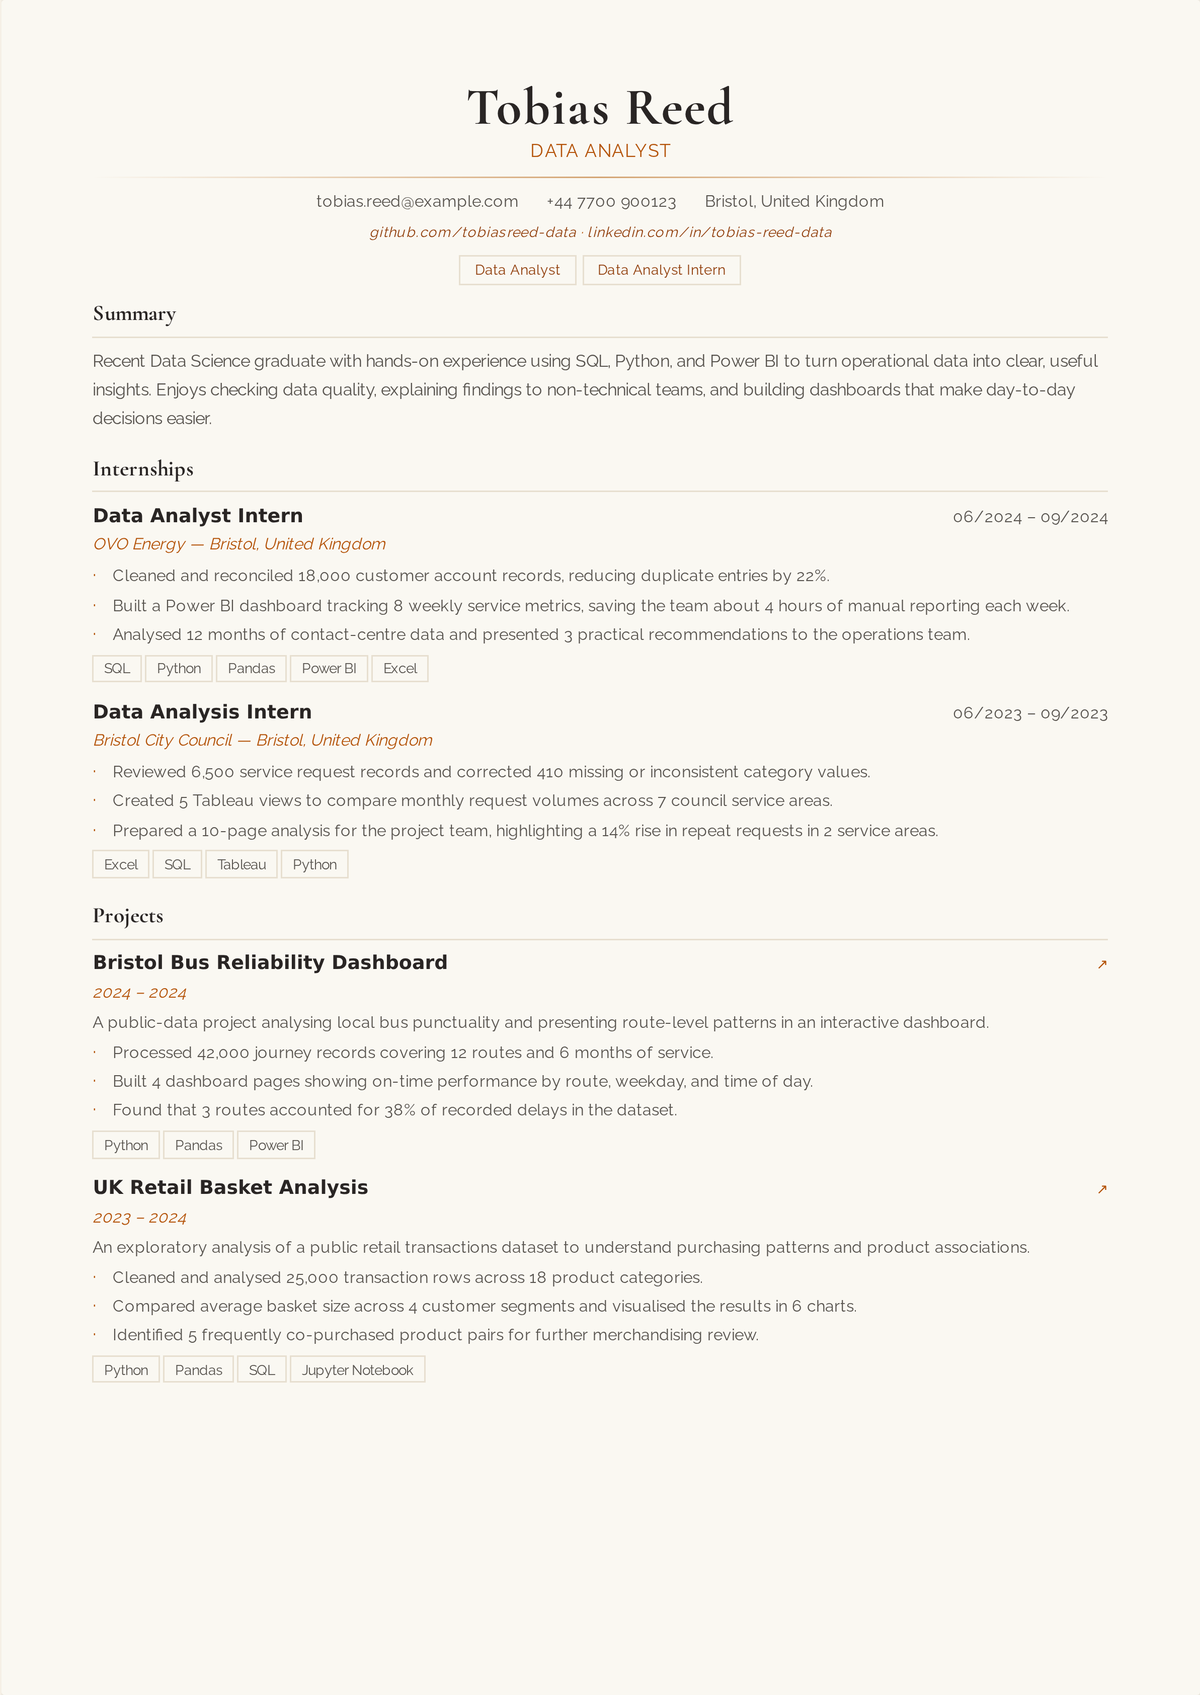
Why this resume works
- The stack leads, with SQL first — the one skill every analyst posting screens for — then Excel, a BI tool, and a scripting language.
- Projects are treated as experience: a capstone, an internship, and a portfolio dashboard, each with a live link a reviewer can open.
- Bullets name the question, the data, and the insight or decision, not just "analyzed data in Python."
- It stays ATS-clean, with standard headings and the exact tool names (SQL, Tableau, Power BI) a parser filters on.
Data analyst (mid-career)
A mid-career analyst owns the full loop from question to recommendation, and this resume shows it. It leads with the stack and the business area supported — marketing, product, finance, operations — then shows the work: writing complex SQL against a warehouse, building and maintaining dashboards stakeholders actually use, running analyses that answered a real question, and presenting findings to people who made a decision from them. The numbers are the outcomes the analysis drove — revenue, cost, retention, or efficiency — plus the scale of the data and the stakeholders served.
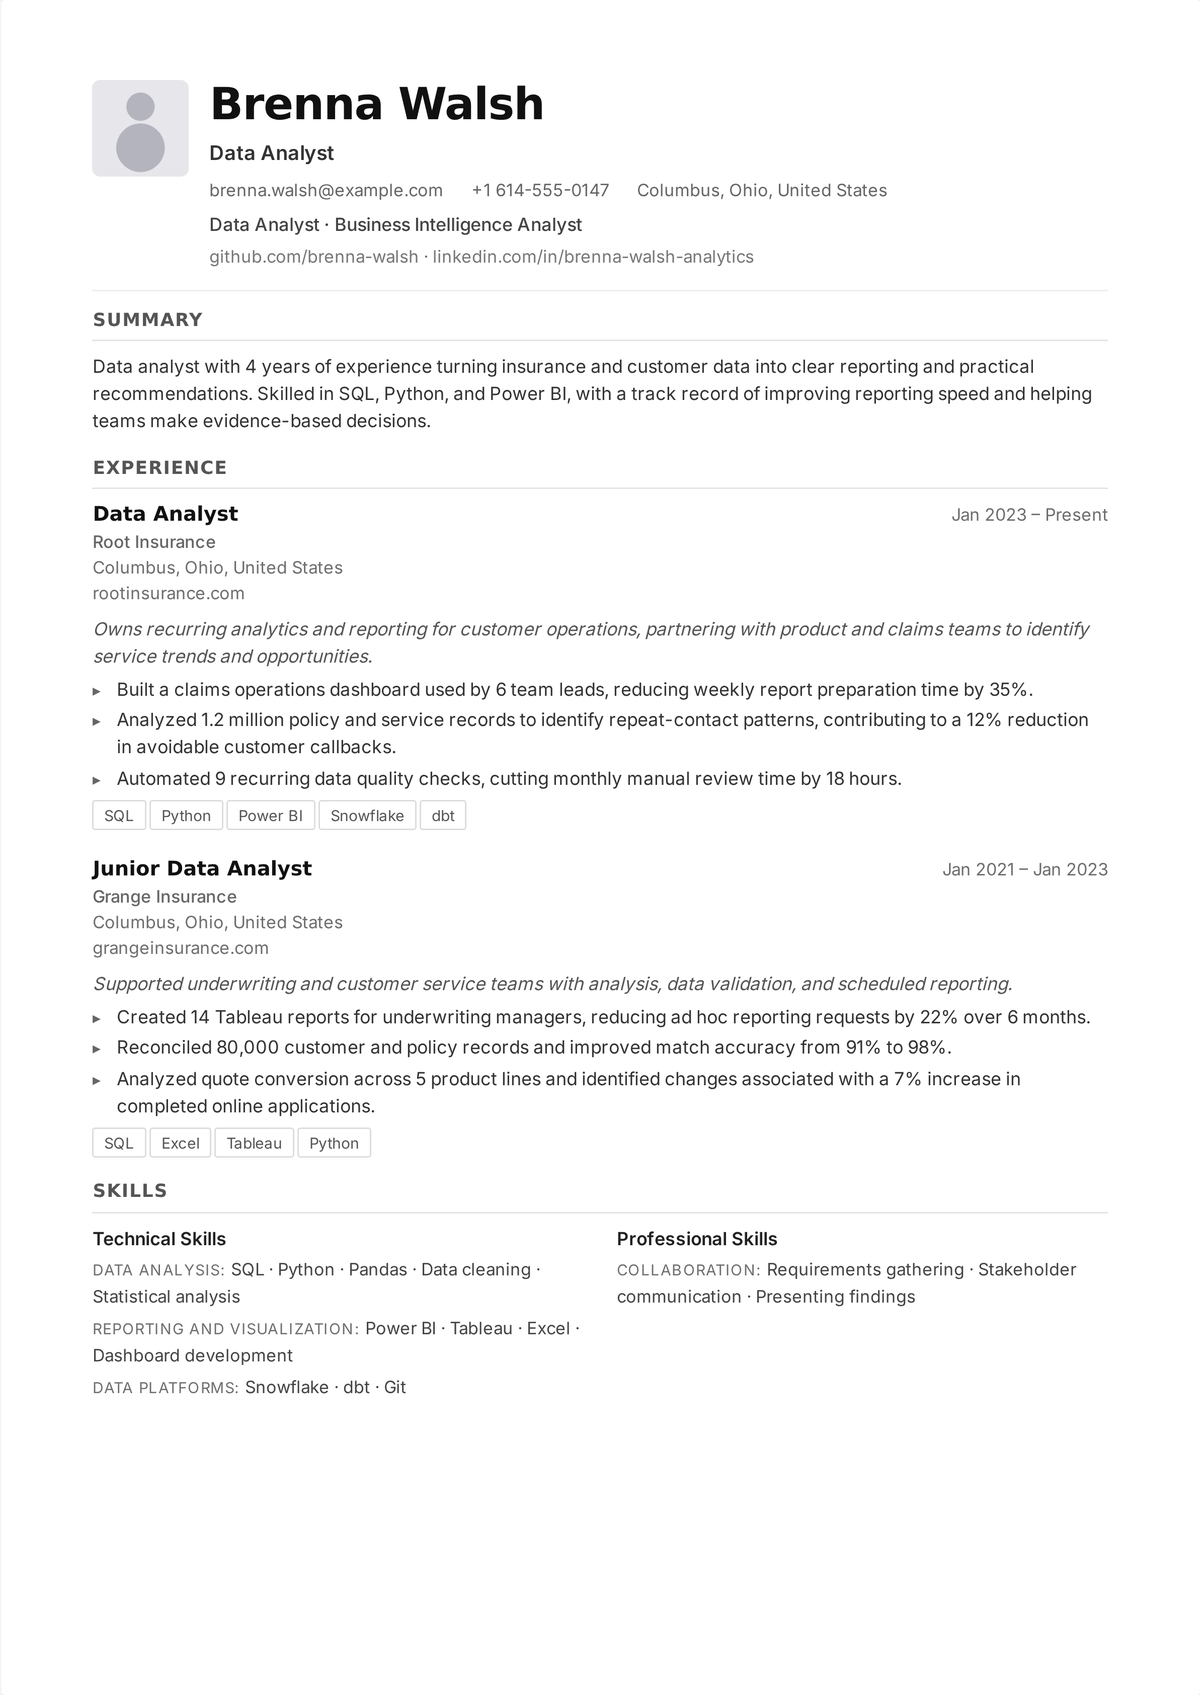
Why this resume works
- It names the business area supported, so a hiring manager sees the domain fit, not just the tools.
- It shows the full analyst loop: complex SQL against a warehouse, dashboards in use, analysis run, and findings presented to decision-makers.
- Every analysis bullet ties to an outcome — revenue, cost, retention, or an efficiency gain — rather than stopping at "built a report."
- It quantifies scale: rows or events analyzed, dashboards maintained, and stakeholders or teams served.
Business intelligence analyst (mid-career)
A BI analyst builds the reporting layer the whole company runs on, so this resume leads with the BI and warehouse stack — Tableau, Power BI, or Looker on top of Snowflake, BigQuery, or Redshift — then shows the work: designing data models and semantic layers, building self-serve dashboards, defining the metrics everyone agrees on, and cutting the manual reporting that used to eat a week a month. The numbers are dashboards and reports adopted, manual-reporting hours saved, data freshness and reliability improved, and the decisions the BI layer now informs across teams.
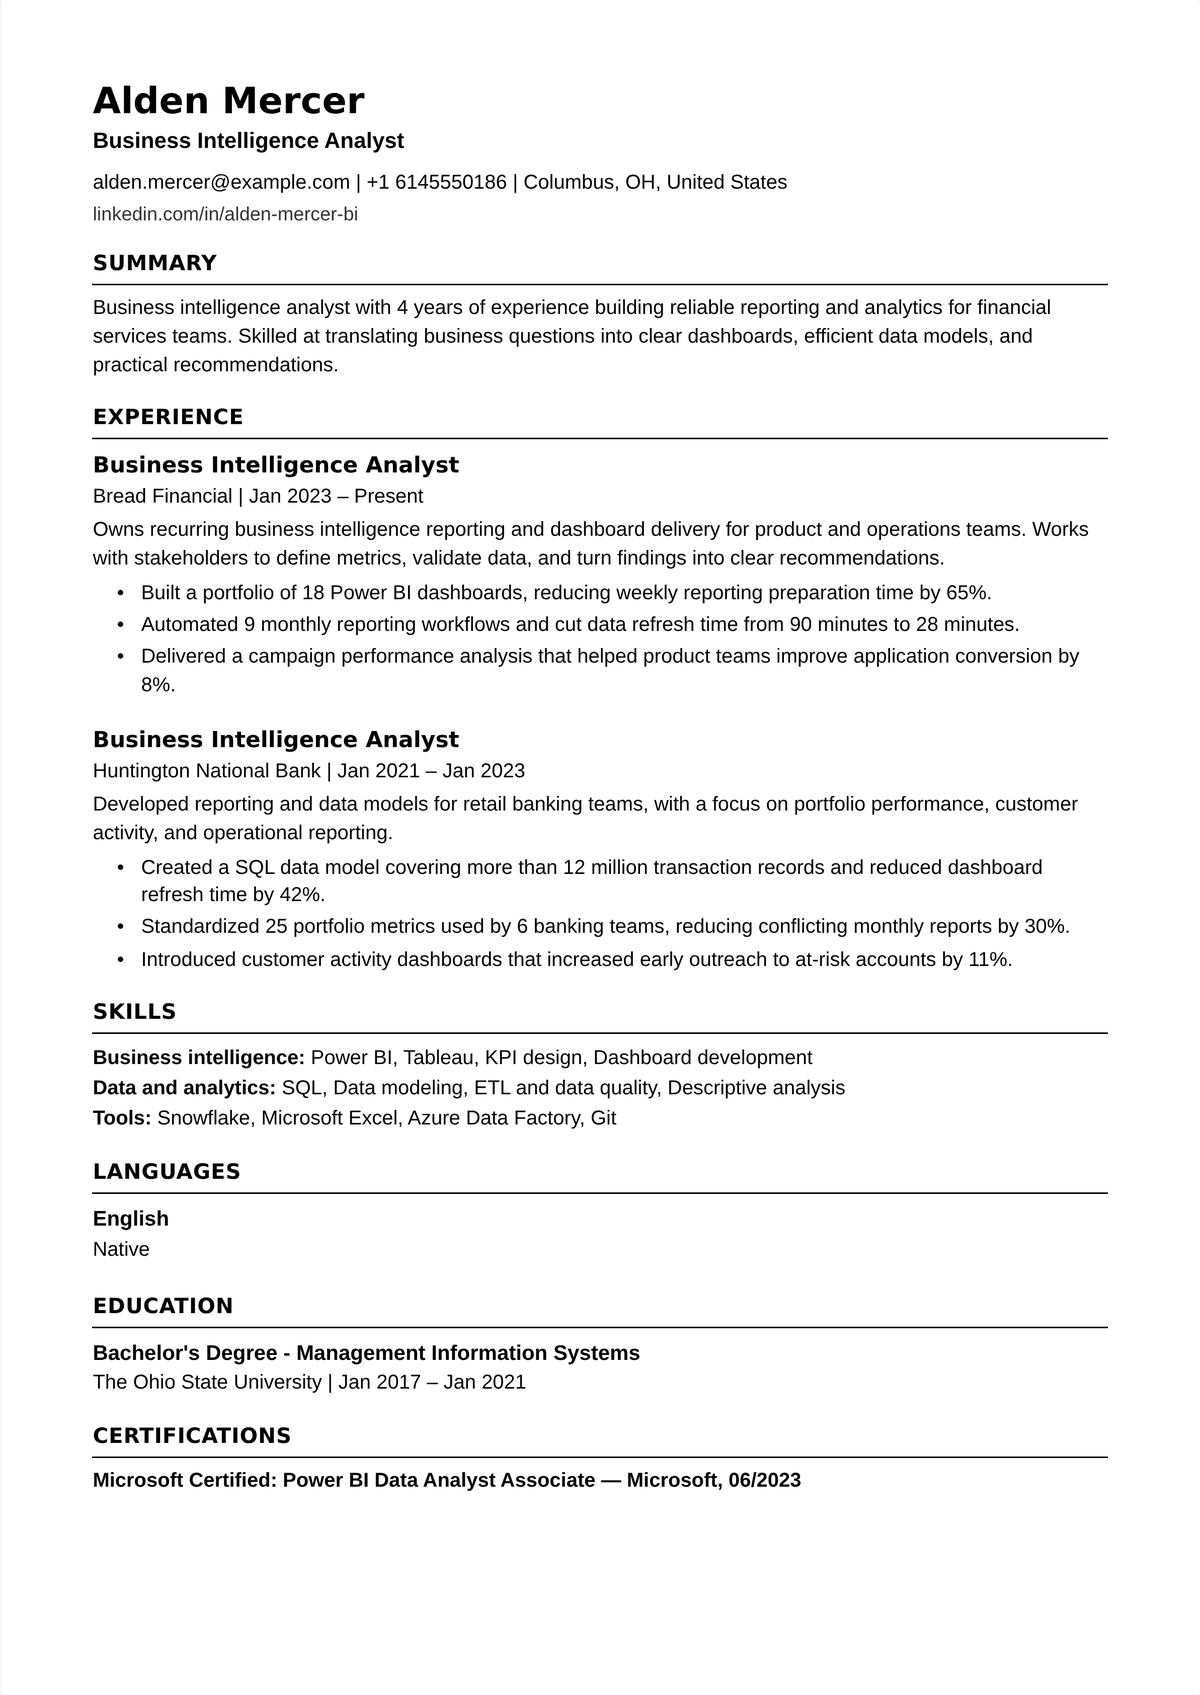
Why this resume works
- It leads with the BI-and-warehouse stack — Tableau, Power BI, or Looker on Snowflake, BigQuery, or Redshift — a BI posting screens for.
- It shows the platform work: data models, a semantic layer, agreed metric definitions, and self-serve dashboards other teams rely on.
- Outcomes are concrete: reports adopted, manual-reporting hours saved, and improved data freshness and reliability.
- It frames the role as enabling decisions across the company, not producing one-off charts, which is the mid-career BI signal.
Analytics engineer (mid-career)
An analytics engineer sits between data engineering and analysis, turning raw data into clean, tested, documented models the rest of the team builds on. This resume leads with the modern data stack — dbt, SQL, a cloud warehouse, and version control — then shows the work: building and testing transformation models, maintaining a well-documented warehouse, enforcing data quality, and giving analysts trustworthy tables to work from. The numbers are models built and tested, data-quality incidents reduced, pipeline run-time cut, and the analyst hours saved by not re-deriving the same logic everywhere.
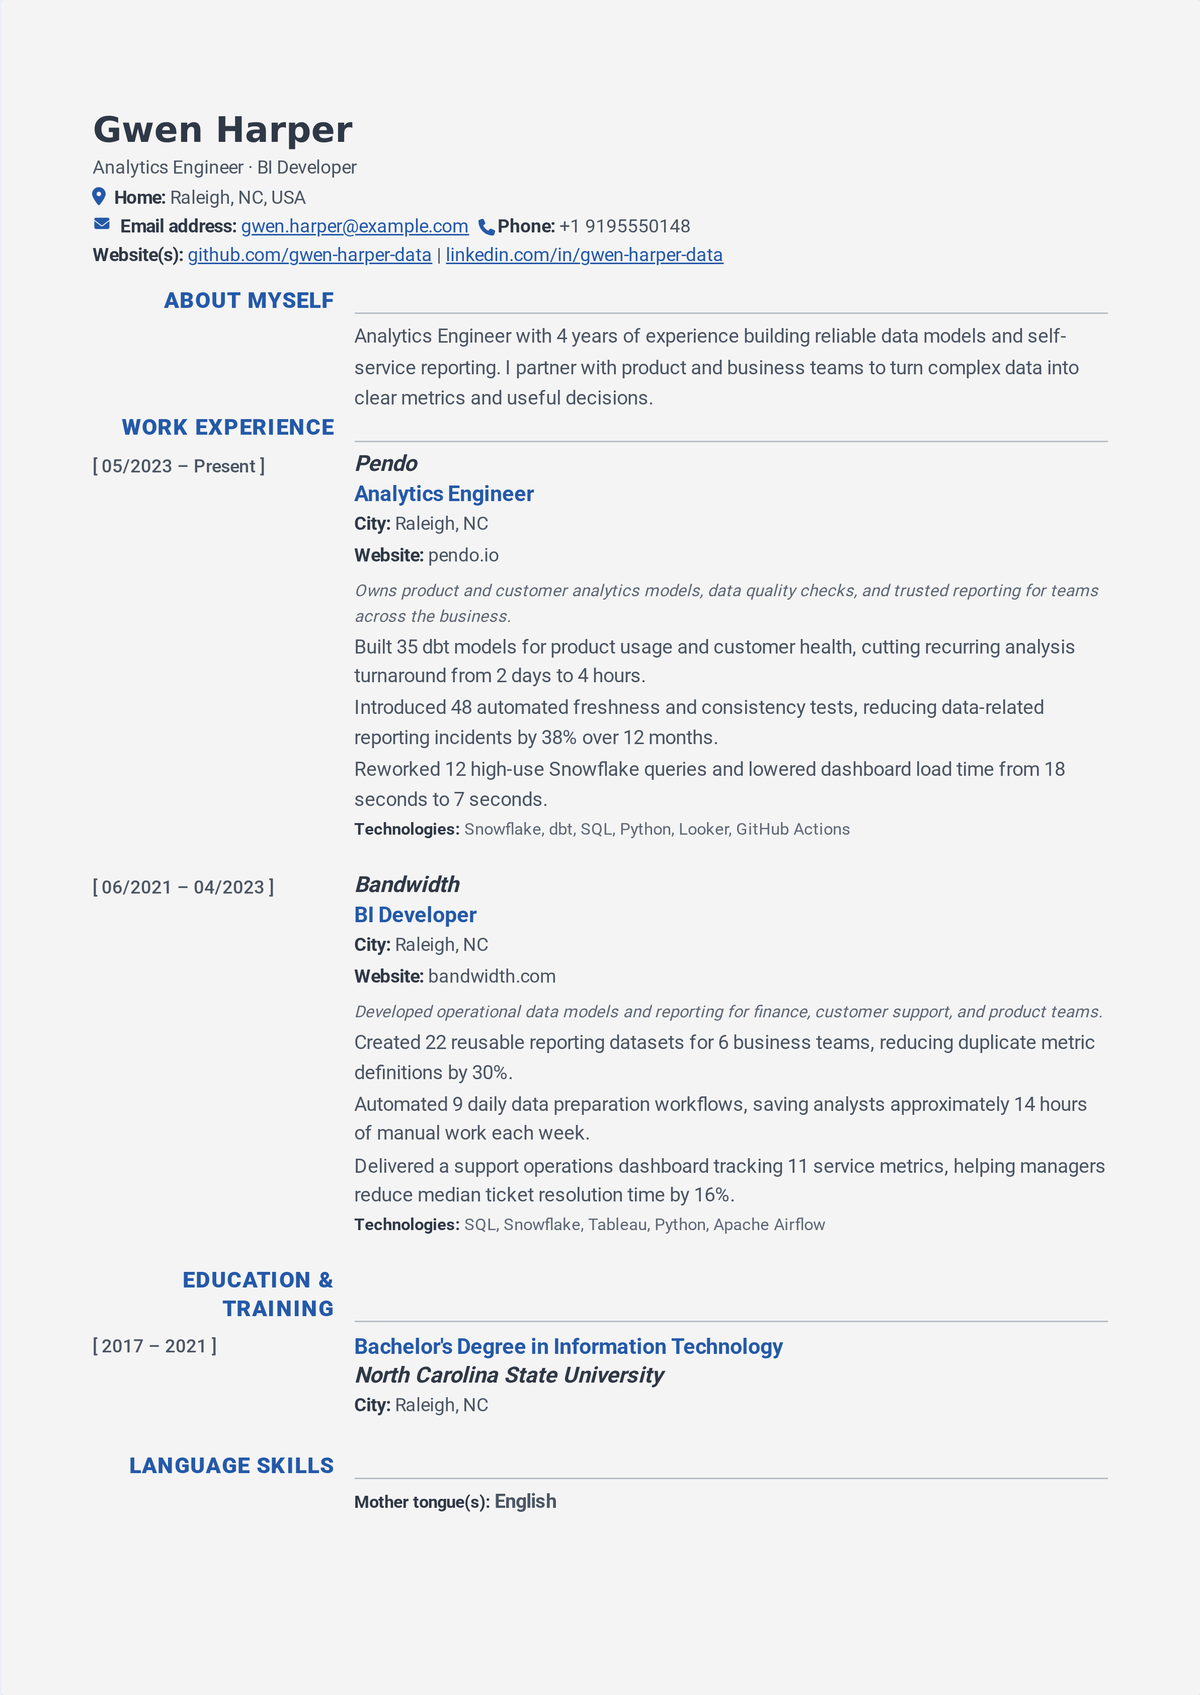
Why this resume works
- It leads with the modern data stack — dbt, SQL, a cloud warehouse, Git — that defines the analytics-engineering role.
- It shows the engineering discipline analysts often lack: tested transformation models, documentation, and version control.
- Outcomes are measured in reliability and leverage: data-quality incidents down, run-time cut, and analyst hours saved.
- It frames the work as building the foundation others rely on, which is exactly how an analytics-engineering posting reads impact.
Data scientist (senior)
A data scientist resume goes beyond reporting into modeling and experimentation, and the strongest ones keep the business outcome in view. This one leads with the stack — Python, SQL, the ML libraries, and statistics — then shows models and experiments that shipped: a predictive model in production, an A/B test that settled a decision, a forecast the business planned around. The numbers pair model performance (accuracy, lift, or a task-specific metric) with the downstream impact — revenue, retention, cost, or risk reduced. It's a senior resume, so it also shows leadership: setting experimentation standards or mentoring analysts. For a research-heavy path, our academic CV guide covers listing publications in full.
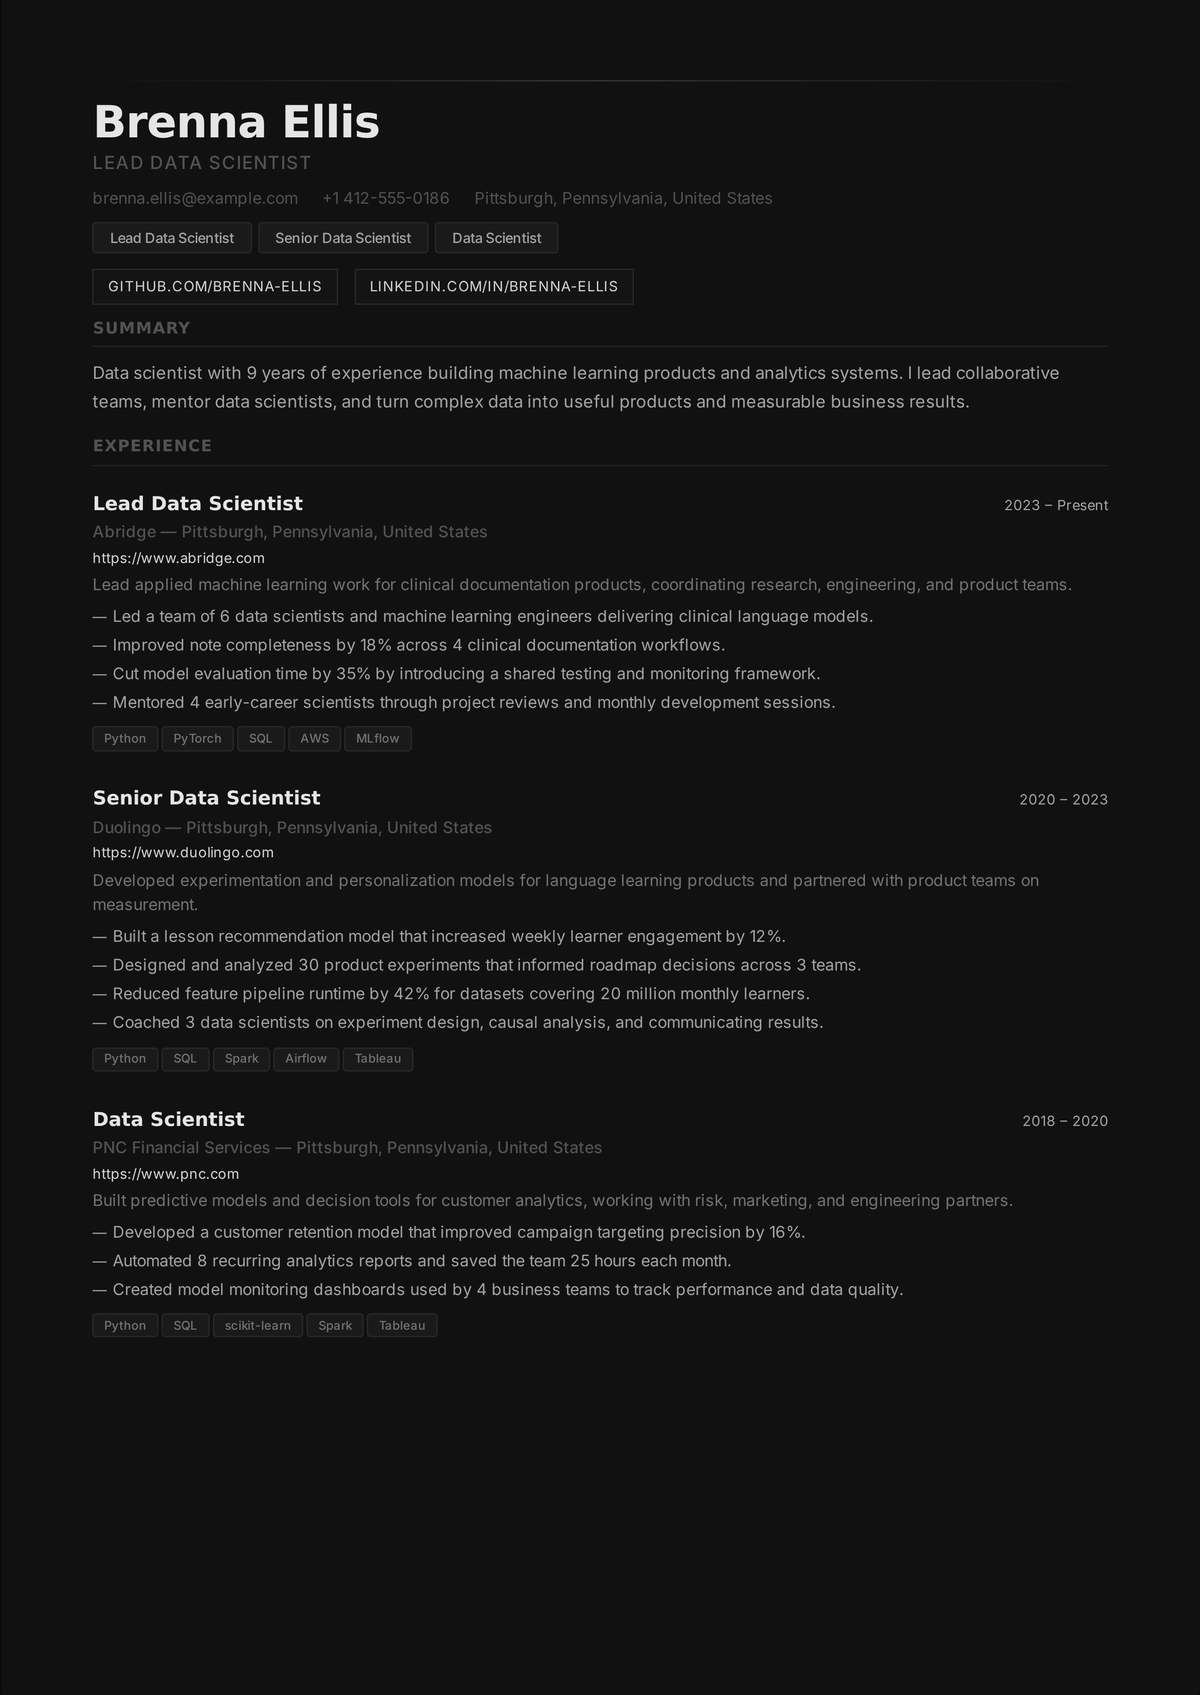
Why this resume works
- It leads with the data-science stack — Python, SQL, ML libraries, statistics — and the methods the role actually uses.
- It shows work that shipped: a production model, a decision-settling A/B test, a forecast the business planned around — not notebooks that stayed local.
- It pairs model metrics (accuracy, lift, AUC) with the business outcome, which is what a hiring manager is really buying.
- At a senior level it shows leadership — experimentation standards set, analysts mentored — that marks the scope beyond individual analysis.
Machine-learning engineer (senior)
An ML engineer on a data team owns the path from a model to a reliable production service, so this resume leans toward engineering. It leads with the stack — Python, the ML frameworks, and the MLOps and cloud tooling — then shows models put into production and kept healthy: feature pipelines, model serving, monitoring for drift, and retraining. The numbers are the downstream impact the model drove and the engineering metrics around it — serving latency, uptime, and the cost of inference. This is where data meets software, and the resume should prove you can do both halves.
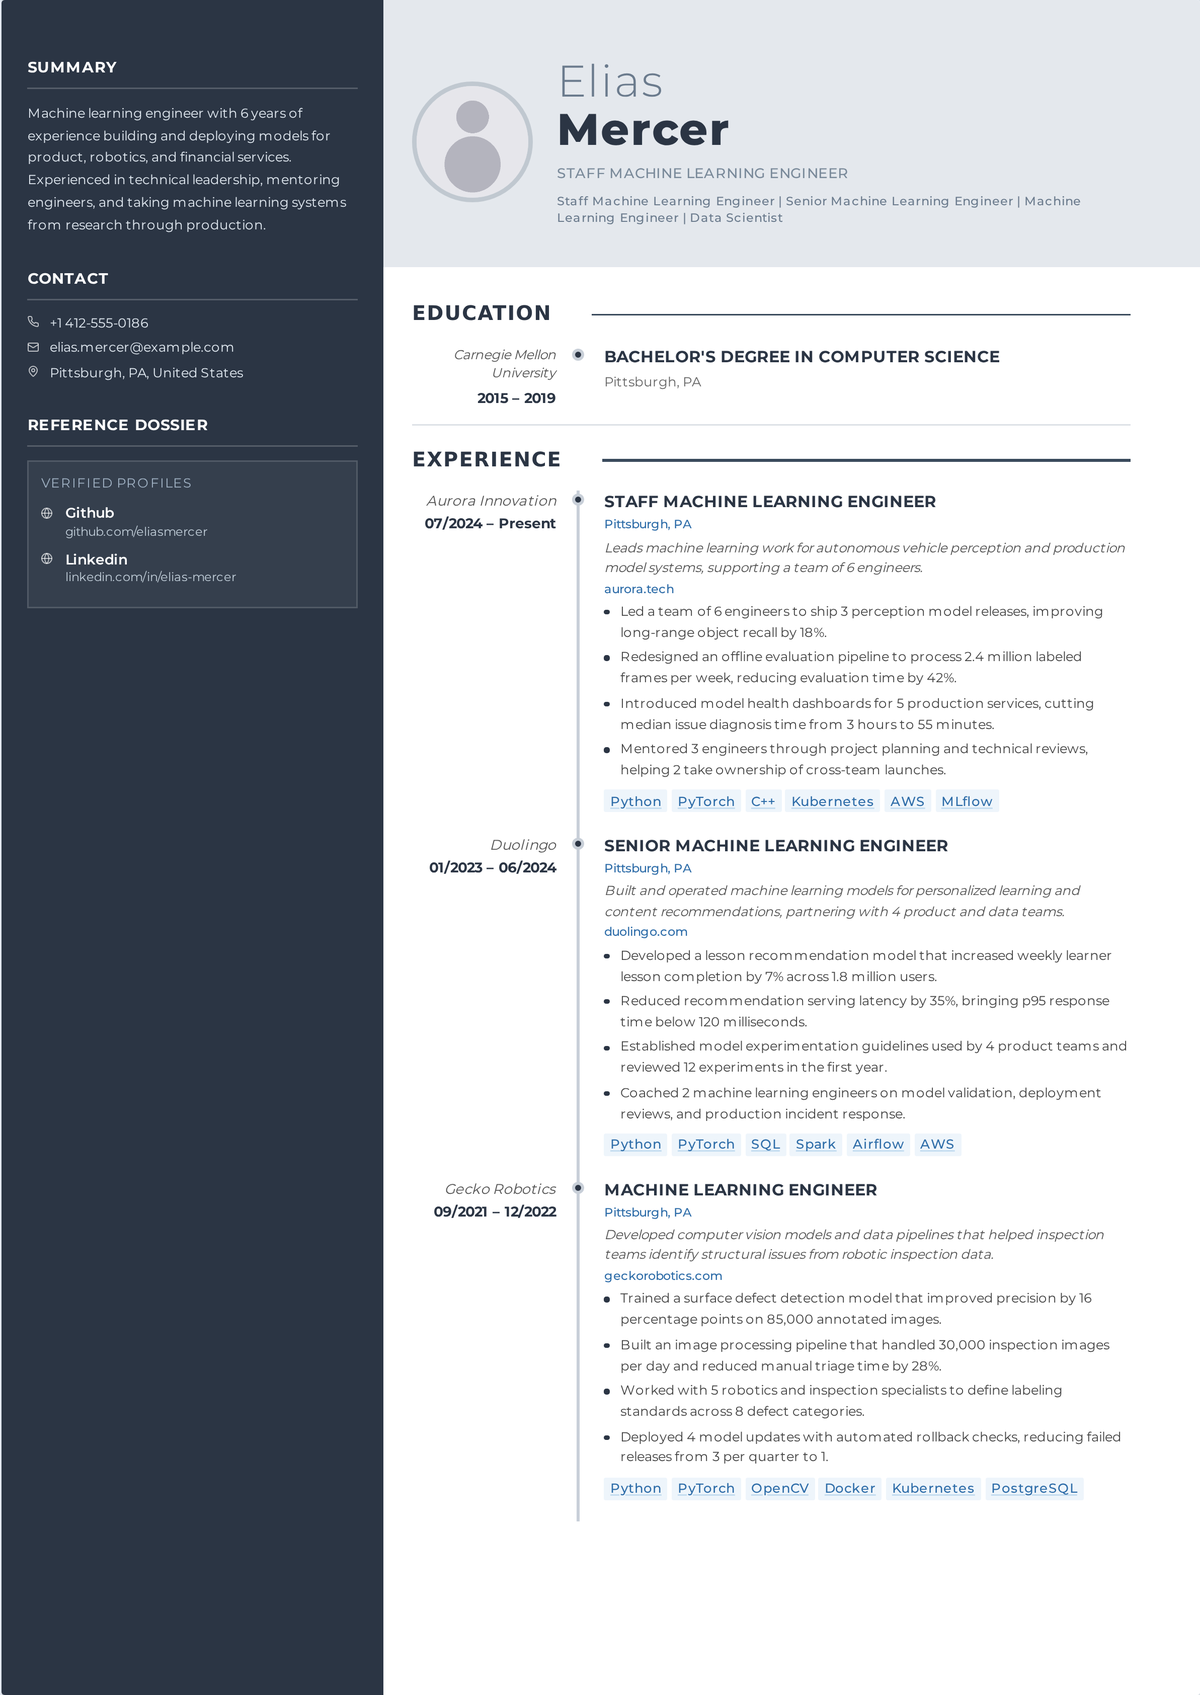
Why this resume works
- It leads with the stack where data meets software — Python, ML frameworks, and MLOps and cloud tooling.
- It shows the full production path: feature pipelines, model serving, drift monitoring, and retraining, not just model training.
- It pairs the business outcome with engineering metrics — serving latency, uptime, and inference cost — proving both halves of the role.
- It names the systems and reliability work that separate an ML engineer from a data scientist who hands off a notebook.
A data analyst resume template you can copy
Here is a complete mid-career data-analyst resume in plain text — single column, standard headings, real numbers. It's a template in the practical sense: swap in your own stack, company, and results, and you have a resume a parser can read and a hiring manager can scan in seconds.
Mei Tanaka
Chicago, IL · mei.tanaka@email.com · (312) 555-0164 · linkedin.com/in/mei-tanaka · github.com/meitanaka
Summary
Data analyst with four years supporting product and marketing teams with SQL, Python, and Tableau. Built the self-serve dashboards that cut ad-hoc data requests 60% and ran the cohort analysis that reshaped the onboarding flow, lifting 30-day retention 9 points. Looking for an analytics role on a product-led team.
Skills
SQL (advanced) · Python (pandas, scikit-learn) · Tableau · Power BI · dbt · Snowflake · Excel · A/B testing · Statistics · Stakeholder communication
Experience
Data Analyst — Lakefront Commerce, Chicago (2022–present)
- Built 12 self-serve Tableau dashboards on a Snowflake warehouse, cutting ad-hoc data requests to the team 60% and freeing ~15 analyst hours a week.
- Ran a cohort and funnel analysis of the signup flow that led to an onboarding redesign, lifting 30-day retention from 41% to 50%.
- Designed and analyzed A/B tests for the marketing team, including a pricing-page test that raised conversion 7% ($340k annualized).
- Defined the company's north-star metric and its SQL logic in dbt, ending months of conflicting numbers between teams.
Junior Data Analyst — Prairie Media, Chicago (2020–2022)
- Wrote SQL to pull and clean campaign data for a weekly performance report used by the VP of Marketing.
- Automated a manual Excel report in Python, cutting a 6-hour weekly task to 20 minutes.
Projects
Chicago transit delays — Analyzed 2M+ CTA records in Python; interactive dashboard and write-up. meitanaka.dev/cta
Education
BS in Statistics, University of Illinois Urbana-Champaign — 2016–2020
Certifications
Google Data Analytics Professional Certificate (2021) · Tableau Desktop Specialist (2022)
What makes this one work: the summary names a concrete outcome (60% fewer requests, +9 points retention) in the first two lines, the skills section lists the exact tools a data posting scans for with SQL first, and every experience bullet ties analysis to a decision or dollar figure. The layout is deliberately plain so an applicant tracking system extracts each field cleanly, and the project link gives a reviewer something to open.
Lead every analysis bullet with the decision it changed, not the tool you used. "Built a Tableau dashboard" is a task; "ran the cohort analysis that reshaped onboarding and lifted retention 9 points" is impact. The tools belong in your skills section and as supporting detail — the hiring manager is buying your ability to turn data into a decision, so put the decision first and let the SQL and Python back it up.
The skills to put on a data analyst resume
Data skills group into categories a recruiter and a parser both scan. List the exact tools — SQL first, nearly always — grouped so the stack reads in a glance, and keep it honest: everything on this list can come up in a technical screen or a take-home. Match the posting's vocabulary where it's true for you.
| Skill area | What to put on the resume |
|---|---|
| Querying & data | SQL (the one non-negotiable), plus the warehouse you've used — Snowflake, BigQuery, Redshift |
| Programming | Python (pandas, NumPy) or R, and the libraries you've actually worked in |
| Visualization & BI | Tableau, Power BI, Looker, or Google Data Studio; dashboard design and storytelling |
| Spreadsheets | Advanced Excel or Google Sheets — pivot tables, lookups, modeling (still expected everywhere) |
| Statistics & methods | A/B testing, hypothesis testing, regression, cohort and funnel analysis, forecasting |
| Modern data stack | dbt, Git, and an orchestration tool (Airflow) for analytics-engineering and senior roles |
| Communication | Translating analysis into a recommendation and presenting to non-technical stakeholders |
Skip skill bars and percentages. "SQL 85%" tells a parser nothing and reads as filler to a hiring manager — and it invites the take-home that exposes it. A grouped, honest list with SQL leading, plus bullets that show the important tools producing a decision, does far more than any graphic.
How to write each section of a data analyst resume
Write a summary that names your stack and one decision you changed
Two or three sentences at the top: your level and years, your core stack, and the single strongest decision your analysis drove. "Data analyst with four years in SQL, Python, and Tableau; built the dashboards that cut ad-hoc requests 60% and the analysis that lifted retention 9 points" tells a hiring manager more than a paragraph about being passionate about data. Name the business area you've supported (product, marketing, finance), because domain fluency is a real signal. Skip an objective statement about what you hope to learn; the summary describes what the team gets.
Turn analysis into decisions and dollars
"Analyzed sales data" describes a task. "Ran the churn analysis that identified the at-risk segment, and the retention campaign built on it recovered $280k a year" describes an analyst worth hiring. Data work is judged on whether it changed something, so a resume that names the outcome stands out in a stack of tool lists. The numbers that carry weight: revenue or cost moved by a decision your analysis informed, efficiency gained (hours or requests saved), retention or conversion lifted by a test, and the scale of the data and stakeholders you served. Only claim what you can walk an interviewer through — they will ask how you got the number.
Before: Responsible for building dashboards and reports in Tableau. After: Built 12 self-serve Tableau dashboards that cut ad-hoc data requests 60% and freed ~15 analyst hours a week for deeper work.
Before: Used SQL and Python to analyze customer data. After: Ran a cohort analysis in SQL and Python that reshaped the onboarding flow, lifting 30-day retention from 41% to 50%.
Lead with projects when experience is thin
For an entry-level or career-changer data resume, a real analysis project does the work that years of experience would. Give your two or three strongest projects real entries: the question you asked, the dataset and its size, the methods and tools, the insight you found, and a live link to the dashboard, notebook, or write-up. A reviewer will click, so make it readable — a clear question, a clean visualization, and a stated conclusion beat a sprawling notebook with no narrative. A Kaggle competition, a capstone, an internship analysis, and a dashboard for a club all count; treat each with the same rigor as a job.
Use the keywords the posting and the ATS scan for
Companies run applications through an applicant tracking system that parses your resume and matches it against the posting. Systems vary — some screen out a missing must-have like SQL, many just rank candidates for a recruiter — but a parser-safe file written in the posting's own words gives you the best odds either way. Reuse the posting's exact tool names where they're honest: if it says "Power BI," "dbt," or "BigQuery," use those terms rather than a generic "BI tools" or "data warehouse." Keep the layout parser-safe: single column, standard headings (Summary, Skills, Experience, Projects, Education), a real-text PDF, no photo, no two-column graphic that scrambles the parse. You can check what a parser actually pulls from your file with Prezumi's free ATS resume checker, and the ATS-friendly templates start you from a layout that already passes.
Data analyst salary insights
Data pay climbs steeply as the role moves from reporting toward modeling and engineering, and it varies a lot by industry and company tier. The ranges below are illustrative U.S. base-salary figures meant to show how compensation scales by role; your actual figure depends on location, industry, and whether equity is in the mix. For current national medians, the U.S. Bureau of Labor Statistics Occupational Outlook Handbook is the citable source.
| Data role | Typical U.S. base salary range (illustrative) |
|---|---|
| Entry-level data analyst | $60,000–$80,000 |
| Data analyst (mid) | $75,000–$105,000 |
| Business intelligence analyst | $80,000–$115,000 |
| Analytics engineer | $100,000–$145,000 |
| Data scientist | $110,000–$165,000 |
| Machine-learning engineer | $130,000–$200,000+ |
Two things move these numbers most: the depth of the technical work and the industry. The jump from analyst to data scientist or analytics engineer — where modeling, experimentation, or production code is on you — is the biggest single step up, and the same role pays well above average in tech, finance, and healthcare. On the resume, that means foregrounding the most technical, highest-leverage work you've genuinely done, and naming the industry and the scale of the data you've handled, because both set the pay band as much as the title.
Build your data analyst resume in Prezumi
Prezumi holds your analytics history as one profile and renders it into any of 55+ templates, so you write the stack, the projects, and the outcomes once. Import an existing resume to skip retyping, pick an ATS-friendly template that keeps a clean single column, and export a text-based PDF for free. When you apply to a specific role, the AI editor rewords your real entries to match that posting (it can only reshape the details you entered, so it won't invent a retention lift), and the ATS checker confirms the file parses before you send it. If this is your first data job, our first-job resume guide shows how to fill a resume with projects, internships, and coursework instead of years on the job, and the student CV examples use the same one-page approach. Want to show the analysis itself? A portfolio website linked from the resume lets a reviewer open your dashboards and notebooks in one click. For the letter that goes with the application, the free cover letter generator works from your resume and the posting.
FAQ
What should a data analyst resume focus on?
Evidence that your analysis changed a decision, backed by the right technical stack. List SQL first — it's the one skill every analyst role screens for — then your programming, BI, and statistics tools, and build your experience around the loop from question to recommendation: what you were asked, what you analyzed, and what the business did differently. Quantify the outcome (revenue, cost, retention, hours saved) rather than stopping at "built a dashboard," and link to a project a reviewer can open.
How do I write a data analyst resume with no experience?
Let projects carry the weight. Give your two or three strongest analysis projects real entries with the question, the dataset and its size, the tools, the insight, and a live link to the dashboard, notebook, or write-up. A capstone, a Kaggle competition, an internship analysis, and a dashboard you built for a club or student org all count. Lead with a skills section (SQL first) and a summary that names your stack, and include a relevant certificate like the Google Data Analytics one. Our first-job resume guide walks through filling a resume without years of paid work.
Is SQL the most important skill on a data analyst resume?
Yes — it's the one skill nearly every data analyst posting requires, so list it first in your skills section and show it producing a result in your experience. After SQL, the common expectations are a BI tool (Tableau, Power BI, or Looker), advanced Excel, and Python or R for deeper analysis. Senior and analytics-engineering roles add dbt, a cloud warehouse, and version control. Match the posting's exact tool names where they're true for you, and be ready to write real SQL in a screen.
What's the difference between a data analyst and a data scientist resume?
A data analyst resume is built around reporting and answering business questions with SQL, BI tools, and straightforward statistics, and it's measured on the decisions and efficiency the analysis drove. A data scientist resume adds modeling and experimentation — a production predictive model, an A/B test that settled a decision — and pairs model performance with downstream impact. If you're moving from analyst to data scientist, foreground any modeling, forecasting, or experimentation you've genuinely done.
How do I quantify impact on a data resume?
Name the decision your analysis changed and the number attached to it. The most persuasive are revenue or cost moved by a decision you informed, conversion or retention lifted by a test you ran, efficiency gained (hours or ad-hoc requests saved by a dashboard or automation), and the scale of the data and stakeholders you served. Write them with context — "cohort analysis that lifted 30-day retention from 41% to 50%" — and only claim what you can walk an interviewer through, because they will ask how you got there.
How long should a data analyst resume be?
One page for entry-level and most analysts with up to roughly ten years of experience. Two pages are justified only when a decade or more of directly relevant, high-impact work genuinely fills them — a senior data scientist or lead with a long record. Keep it dense and specific; a hiring manager scanning a stack would rather see one strong page with clear outcomes than two padded with every tool and course.
Should I list data certifications on my resume?
They help most at the entry level, where they signal you've learned the core tools. Recognized ones include the Google Data Analytics Professional Certificate, Tableau and Power BI certifications, and for more technical roles, cloud data certifications (AWS, GCP, Azure) or a dbt certification. Put them in a short Certifications section. They won't carry a resume once you have real experience — measured outcomes do that — but a relevant certificate can tip an early-career decision.
Should a data analyst resume include a portfolio link?
Yes, and it matters most early in your career. A portfolio with two or three clean analysis projects — each with a clear question, a readable dashboard or notebook, and a stated conclusion — lets a reviewer see how you think, not just what tools you list. Put the link in your header. For entry-level candidates especially, a strong portfolio can do more than a GPA. A portfolio website linked from the resume lets you show the analysis itself in one click.
How do I make my data analyst resume ATS-friendly?
Use a single-column layout, standard section headings (Summary, Skills, Experience, Projects, Education), and a PDF that contains real extractable text rather than an image. Reuse the exact tool names from the posting where they honestly apply — "Power BI," "Snowflake," "dbt" — and leave out two-column graphics, skill bars, and icons that scramble parsing. Prezumi's free ATS resume checker runs real text extraction on your file and shows you what a parser pulls out, so you can confirm your stack reads cleanly before you send it.
Should a data analyst resume include a photo?
No, for jobs in the US, UK, Canada, and most of Europe. Companies don't need a photo, many prefer applications without one to avoid bias, and a photo can trip up an applicant tracking system. A few countries do expect a photo on any CV; follow local convention if you're applying somewhere that clearly asks for one, but leave it off by default.
How do I target my data resume to a specific job?
Read the posting for the stack and the domain, then make the resume reflect both. Put the exact tools it names into your skills section where they're true for you, lead the experience with the analysis closest to what the role does, and adjust the summary to name the right business area. Don't claim a tool you haven't used, but do reorder and reword your real work so the match is obvious. Prezumi's AI editor reshapes your real entries to a posting without inventing anything, and the ATS checker confirms the file still parses cleanly.
About the author
Zubair Baqai is an AI engineer and the founder of Prezumi. He started it after researching what gets candidates interviews at companies like Google, Meta, Microsoft and Amazon. He writes Prezumi's guides on resumes, ATS screening and CV formats. About Prezumi
Your job-search toolkit
Free tools for every step of a job application. No signup.
- Write a tailored cover letter — Upload your resume, paste the job description, pick a style, and get a cover letter matched to the role in under a minute.
- Turn your resume into a website — Convert your resume into a live personal website with a matching online resume and one shareable link for recruiters.
- Check if ATS can read your resume — Upload your PDF and get an instant score for text extraction, reading order, sections, contact info, and content strength.
- Write a resignation letter — Fill in your name, role, and last day, pick a tone, and get a clean, professional resignation letter to copy or download as a PDF.
- Convert to a Harvard resume — Reformat any resume into the Harvard career-services layout used by students and recent grads — preview instantly, download the PDF free.
- Translate your CV — Translate your resume between English, Spanish, German, French, Italian, Portuguese, Turkish, and Arabic — layout and dates kept intact.
- Fix weak resume wording — Find buzzwords, weak verbs, vague bullets, and missing metrics. Get a 0–100 wording score and stronger rewrites.
- Convert to a Europass CV — Turn any resume into the Europass-style format European employers expect — preview instantly, download the PDF free.
- Convert GPA & grades — Convert between US GPA, percentage, letter grades, UK honours, ECTS, and 10-point CGPA — and see if you graduated cum laude.
